Videos
Watch our videos to learn how to leverage our services.
Videos
Care Pathways
Diagnosis and Treatment of Congestive Heart Failure in the Primary Care Setting
In this webinar, Dr. Imburgia explains how a primary care provider can help diagnose and treat Congestive Heart Failure (CHF) by understanding heart failure risk factors; how to identify heart failure in those at-risk; principles of heart failure management…
Navigating Gastrointestinal Conditions: Diagnosis, Treatment, and Best Practices
In this webinar, Dr. Korenblit will explain how a primary care provider can help diagnose and treat common Gastrointestinal conditions by: understanding the function of the pancreas in normal digestion; describing exocrine pancreatic insufficiency (EPI)….
Navigating Orthopedic Challenges: Leveraging eConsults for Common Conditions
Learn how a primary care provider can help diagnose and treat common orthopedic conditions by identifying orthopedic conditions suitable for local management and
understanding an overview of different types of arthritis, including osteoarthritis (OA).
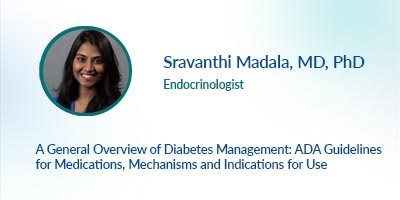
A General Overview of Diabetes Management: ADA Guidelines for Medications, Mechanisms and Indications for Use
Explore clinical factors when determining the best strategy to improve glucose control in patients with type 2 diabetes, review current ADA guidelines for diabetes management, enhance your…
How to Launch an eConsult Program – Successfully
The biggest challenge is getting your doctors excited about using this new technology. A successful eConsult launch educates and engages physicians on the benefits…
Nephrology eConsults: How to Manage Chronic Kidney Disease
Learn how to treat patients with Chronic Kidney Disease (CKD) in the primary care setting. In this webinar, Dr. Patel will review exposures and susceptibilities leading to Acute Kidney Injury (AKI); risks of prerenal, intrarenal and postrenal AKI; and recommended diagnostics for AKI.
Identifying Conditions Easily Managed in the Primary Care Setting
If it’s not urgent, procedural or diagnostic, it likely can be managed in the primary care setting using an eConsult. eConsult specialists also support patients with chronic conditions…
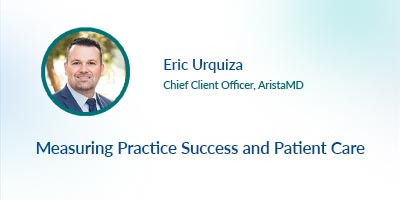
Measuring Practice Success and Patient Specialty Care Access
Eric Urquiza, Chief Client Officer at AristaMD, showcases best practices for measuring the impact of eConsults on practice success and patient specialty care access.
How to Provide Specialist Care – FAST, with an eConsult Platform
eConsult platforms allow PCPs to realize telehealth benefits within clinical practice. What FAST access to specialty care means for PCPs & patients, learn more!


